I want to share a couple of thoughts and insights on how data produces Fata Morgana’s . I have become a bit obsessed lately with how easy it is to be fooled by data. In this blog want to argue that many researchers and data scientists fall for exactly the same mistakes as conspiracy theorists.
 The psychology behind Conspiracy Theorists.

You probably heard of Qanon. It’s a conspiracy theory about liberals running secret Satan-worshipping, child molesting, blood-drinking networks. The Qanon theory spread like wildfire on the internet in the last couple of years. In a brilliant post on Medium a while ago, a game designer argued that the nature of Qanon is strikingly similar to a well designed Alternate Reality game.
Alternate reality games (ARG’s) are designed for you to look for cues to solve a puzzle. One of the problems that game designers often encounter is a phenomenon called “apophenia”. Apophenia is: The tendency to perceive a connection or meaningful pattern between unrelated or random things (such as objects or ideas). Better said:
Once you are searching for patterns, you will start finding them everywhere.
Your players might encounter some scraps of wood on the floor that accidentally form an arrow, and they will become convinced that this must be a clue and can’t be a coincidence.
The same mechanisms are at play in the alternate reality of conspiracy theorists. The thrill of being a Qanonist is that cues are everywhere. Once you are sucked into the community of like-minded truth seekers’, you will stumble upon cues that are so convincing that they must be true. The addictive part is the fact that your fellow conspiracists will challenge you to connect the dots for yourself. “Wake up! Open your Eyes!” Nobody tells you what to think or believe, but once you connect the dots, the truth will reveal itself. Cracking the puzzle is similar to the dopamine rush you get from solving a game puzzle.
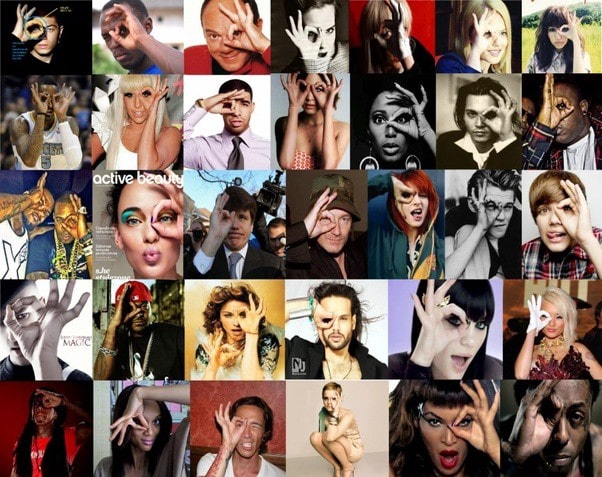
Of course, the problem is: Once you start looking for patterns, you will always find some. You don’t believe in Illuminati? Well, what about all these pictures of Hollywood stars who use the Illuminati “one eye” symbol? Coincidence? I don’t think so?
Still not convinced that liberals run satanic networks? Well, why do all these Hollywood stars use the 666-symbol, the number of Satan? Once you start looking for it, it’s so damn obvious! How can we all have missed this? Of course, all of this is an illusion. An illusion fostered by wishful thinking, selective attention and the addictive thrill of finding patterns.
Want to learn how to apply behavioural science in practice?
Then the Fundamentals Course is perfect for you! You'll catch up on the latest behavioural science insights and will be handed tools and templates to translate these to your daily work right away. Learning by doing. We have created a brochure that explains all the ins and outs of the Fundamentals Course; feel free to download it here.
Data Scientists are a bit like conspiracy theorists.
Today I read a piece in the Dutch newspaper NRC about recent research amongst Dutch voters. We’re having elections here within five weeks. The study delved deep into the wants and beliefs of the Dutch electorate. And lo and behold, it discovered some fascinating patterns: “About 30% of the population are culturally conservative but economically liberal”. Or “There’s still an untapped potential if far-right parties would embrace more leftwing policies” or “Although 70% are in favour of a big government and income redistribution, progressive parties are suffering from a steady decline. This loss can be attributed to the fact that only a minor group of those people (15%) favour progressive themes as abortion, euthanasia, multi-culturalism and European unification”.
The problem with all the above: Sounds reasonable, but it’s bullshit. Real people don’t change their voting behaviour based on these issues. They answer a different question in the voting booth: Which leader or team do I trust the most to fight for the things that threaten my way of living? To whom do I sympathize?
Under the article, NRC posted a series of short portraits of voters and their consideration. The first portrait was featuring an entrepreneur, aged 35. Every time he filled in a voting configurator online, the Dutch Liberals came out as the party that best matches his beliefs and values. Yet he categorically decided not to vote for the liberals because he chose to answer a more powerful different question: He feels it’s time for a system reboot. So he feels more sympathy for the challenger parties, some to the far left, some to the far right. He voted for the FvD (a far-right party), but only because he felt sympathy for one of the (ex) leaders’ fighting spirit, even though he despises their racist whistleblowing.
Why you should have a healthy distrust for data.
The problem with quantitative research is that numbers and graphs signal objectivity and power. If you make the case with solid data, you are more convincing. But the problem is that the patterns we find are often a mirage. A fata morgana that the dataset produced. In the case of Qanon, the fata morgana is produced by combining random pictures that suggest a secret code. In the research above, the fata morgana is created by asking for beliefs and values within the voter base of parties. But it only takes a simple look beyond to data to realize that parties’ rise and fall have everything to do with the rise and fall of their leaders.

Tom De Bruyne
Co-Founder SUE Behavioural Design
PS: If you like this post, don’t forget to subscribe to our free Behavioural Design newsletter, in which we look at the world around us to decode how influence works.
How do you do. Our name is SUE.
Do you want to learn more?
![]()
Suppose you want to learn more about how influence works. In that case, you might want to consider joining our Behavioural Design Academy, our officially accredited educational institution that already trained 2500+ people from 45+ countries in applied Behavioural Design. Or book an in-company training or one-day workshop for your team. In our top-notch training, we teach the Behavioural Design Method© and the Influence Framework©. Two powerful tools to make behavioural change happen in practice.
You can also hire SUE to help you to bring an innovative perspective on your product, service, policy or marketing. In a Behavioural Design Sprint, we help you shape choice and desired behaviours using a mix of behavioural psychology and creativity.
You can download the Behavioural Design Fundamentals Course brochure, contact us here or subscribe to our Behavioural Design Digest. This is our weekly newsletter in which we deconstruct how influence works in work, life and society.
Or maybe, you’re just curious about SUE | Behavioural Design. Here’s where you can read our backstory.